How to Load Data from a Folder in Power BI

Importing into an application is an obvious logical step before we perform any sort of procedures on our data. However, ever wondered what or how would it be if such data is spread out amongst multiple files and needs to be present in one dataset as a pre-requisite? Ever wondered if such sort of imports can be done in a single go and avoid manual repetitions?
One powerful Power BI feature is it enables us to import data from multiple files located in a folder. To be able to do this, the files must have the same schema (same number of columns, same column names, same datatype per columns, etc.).
In this article, we will outline and illustrate this feature in more detail.
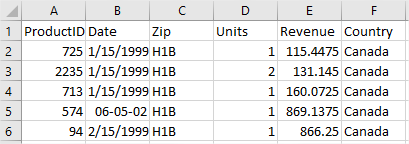
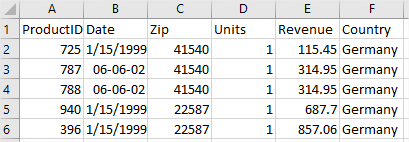
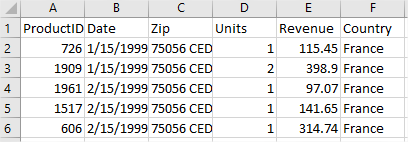
Let’s suppose that we have four sales files, each representing sales generated in a different country.
Let’s see the structure of each of these files:
We can see that the structure is the same and the main difference in these files is that the sales are generated in four different countries (Canada, Germany, France and Mexico).
Now we will import these files into Power BI Desktop.
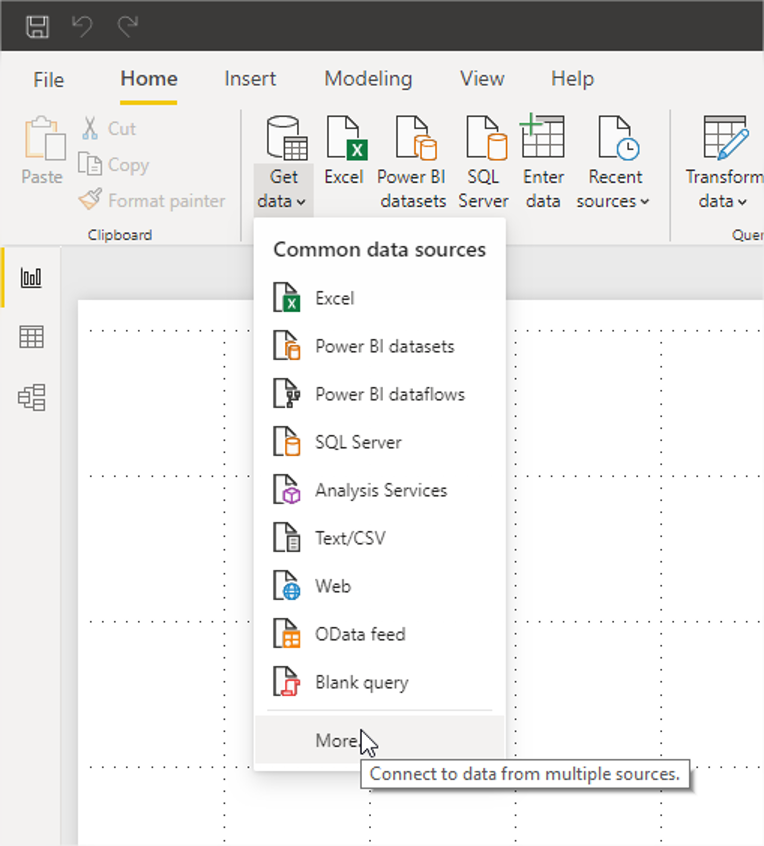
First, we go to the “Home” tab. There, we choose “Get data >> More…” option.
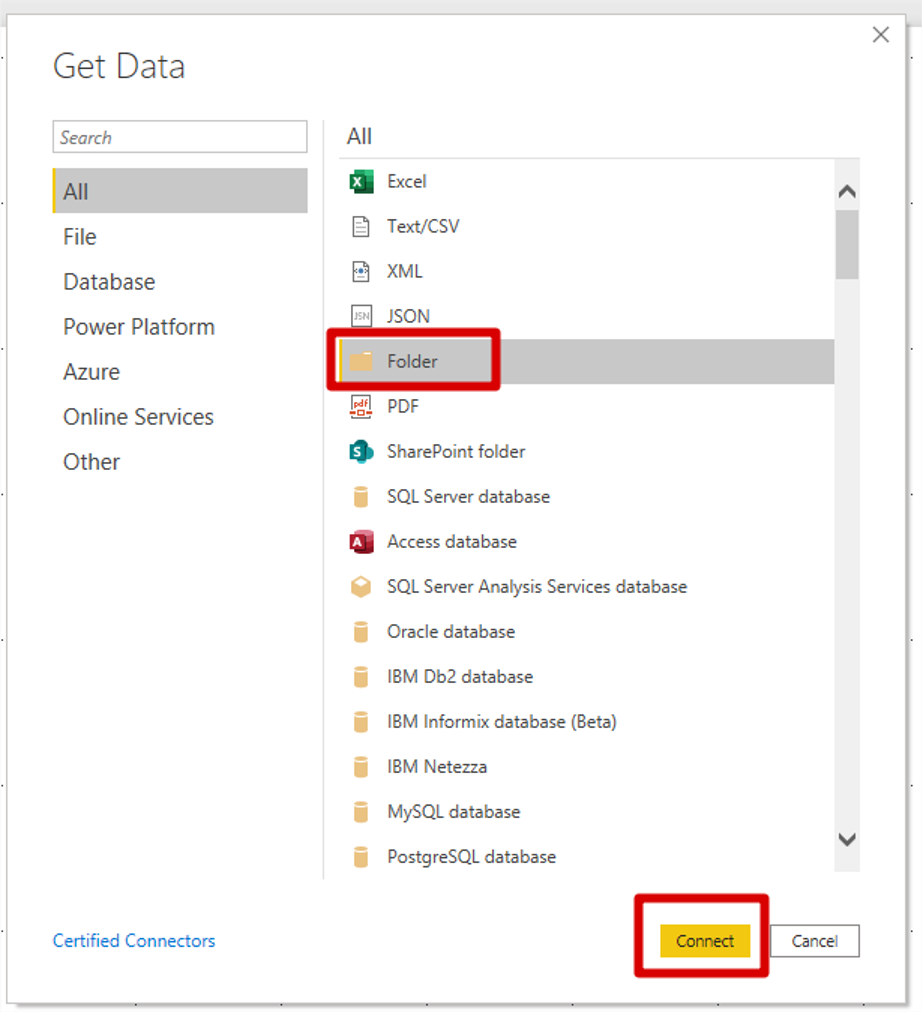
This will open the Get Data dialog.
We click Folder and then Connect. A new dialog box opens in which we have to provide the folder path that has our intended files.
After selecting the file path, we click OK.
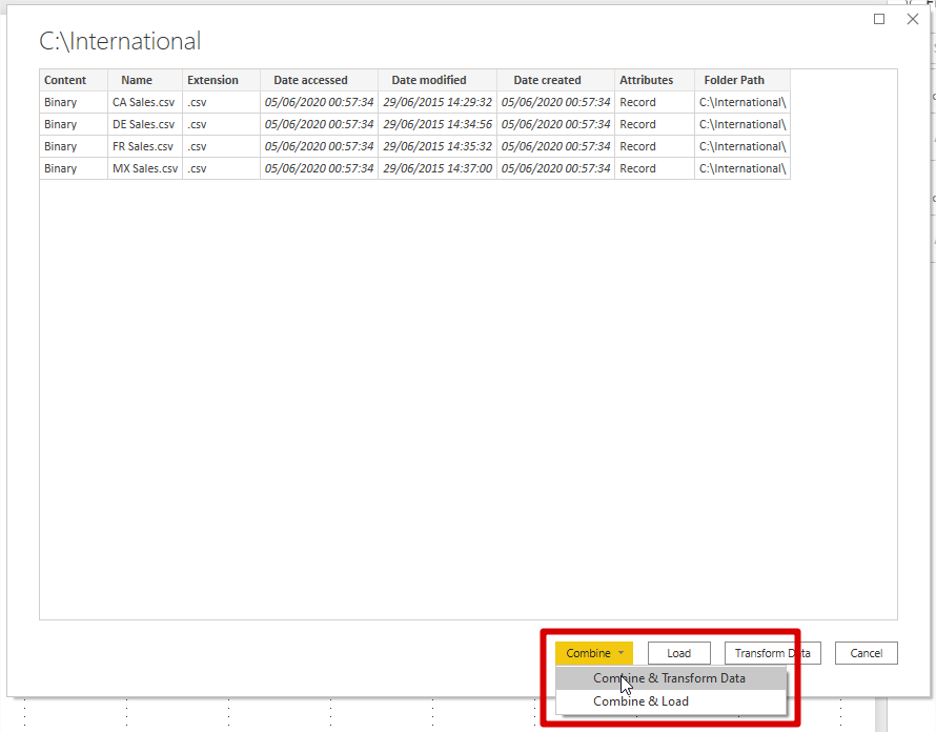
We can see that the files are read successfully.
Now, we can choose to either Combine and directly load the files, or to Combine and Transform to go to the Power Query Editor.
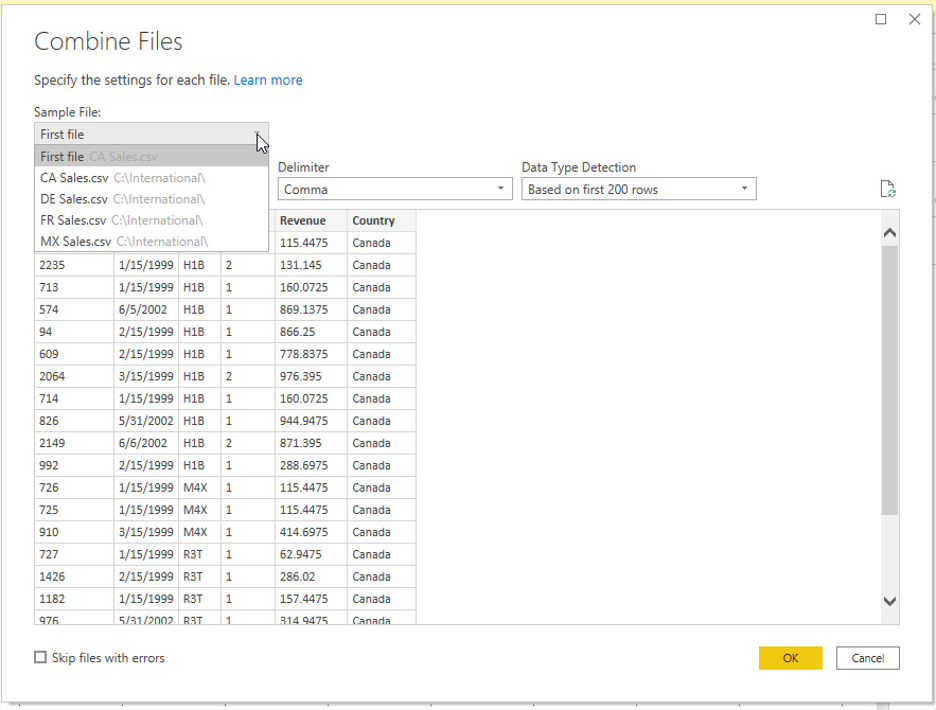
After this, we can see the Preview of combined data.
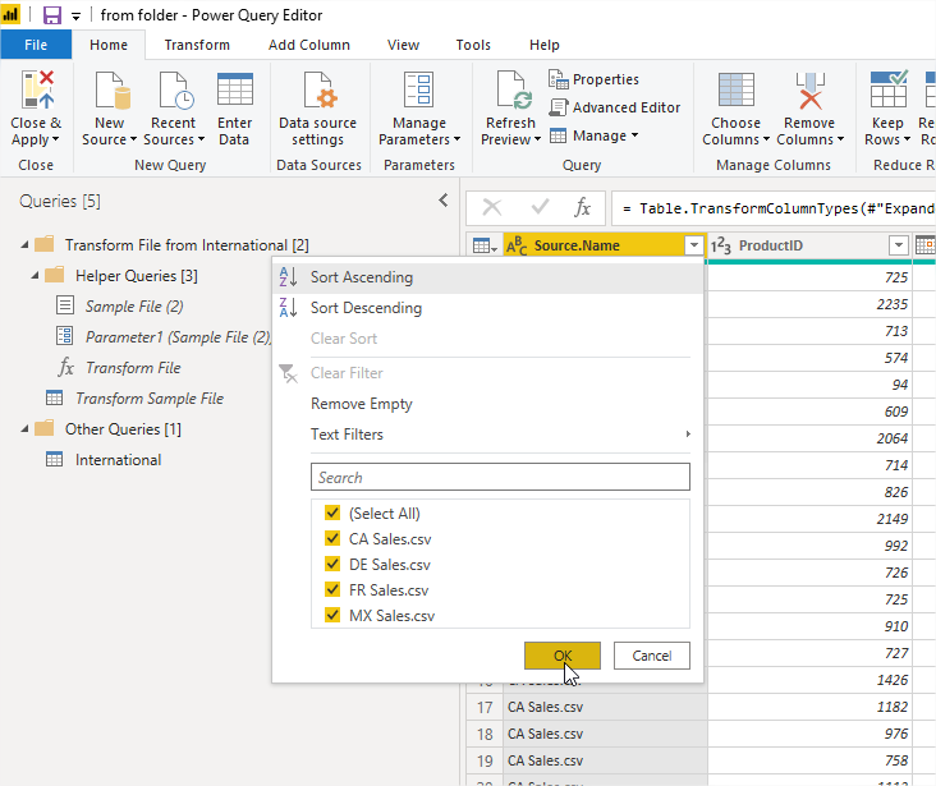
We now click OK and we go to the Power Query Editor. Here, we can see how Power BI combined the files into one single table:
It is important to note that besides original columns from files, Power BI added a new column that specifies from which file is the specific row in the table.
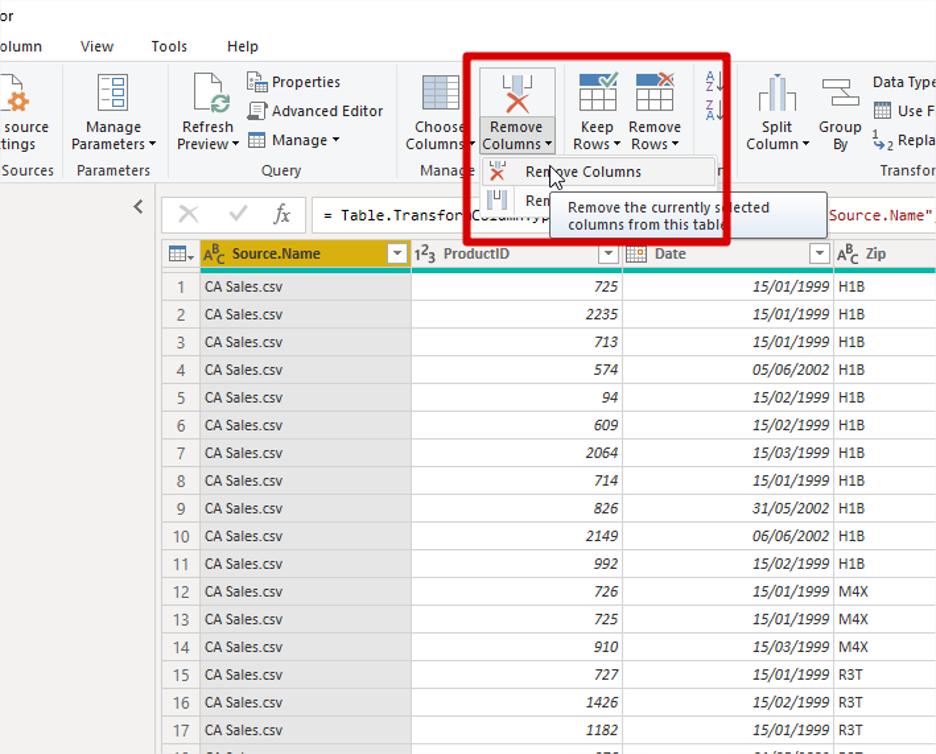
This column is very important, and we can use it like every other column to slice data based on its values (In this case its Country). But in this case, we already have a Country column, therefore we do not need it and we will remove it. By having the column selected, we click Remove Columns.
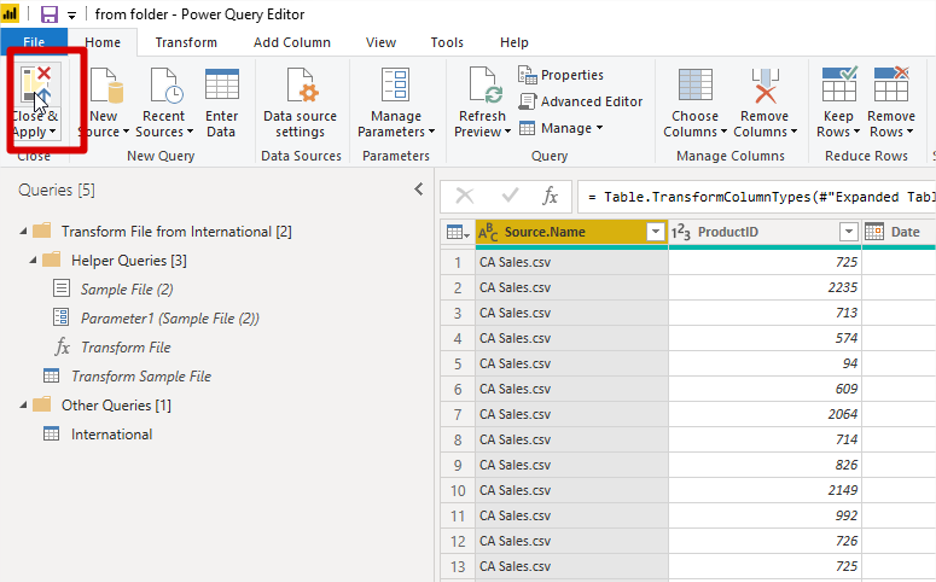
Now, the data is ready for creating visualizations. We click Close & Apply and we get back to the Power BI Desktop Report View.
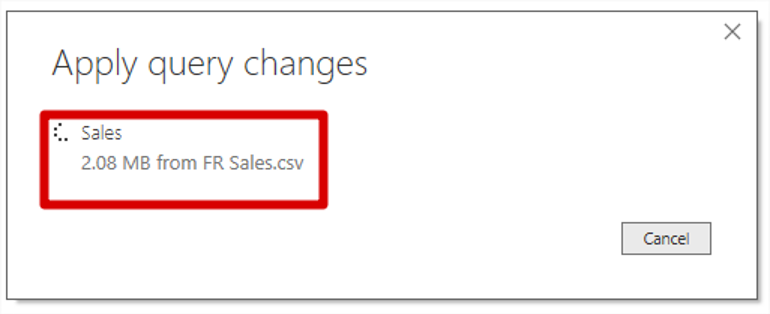
One by one, all the files are loaded by going through query steps we saw in Power Query Editor:
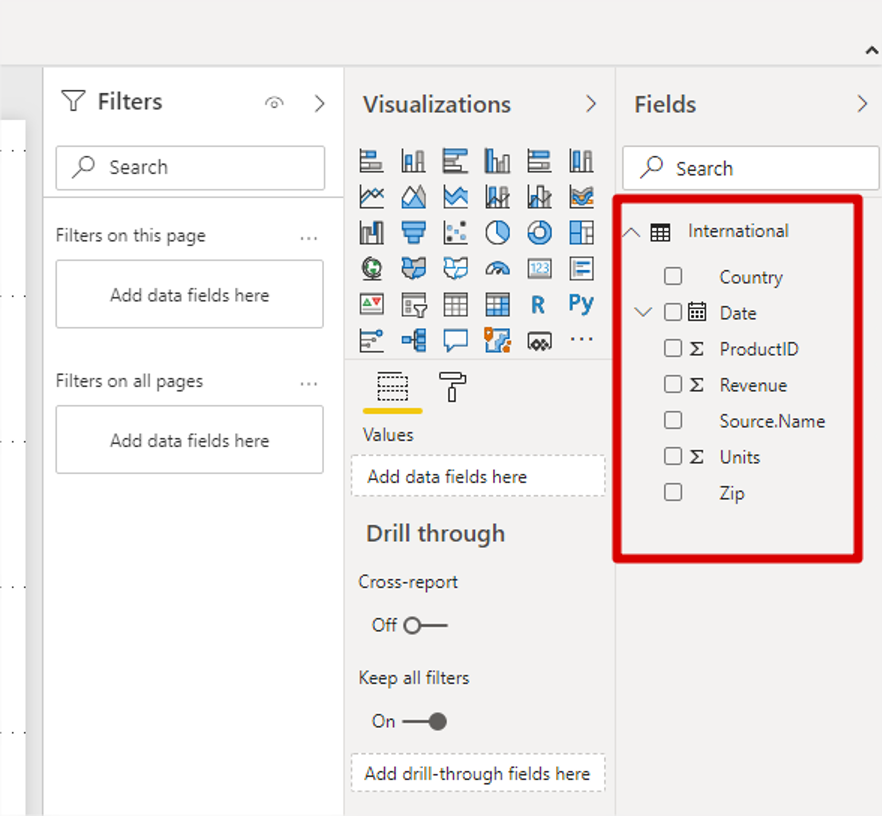
We can see that even though we had four different files to load, we now have only one table in our Power BI model.
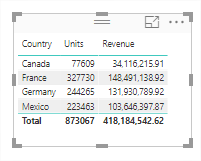
Let us now explore data by creating a table visual containing Country, Units and Revenue columns:
We can see that the values for Units and Revenue are summarized and these represent the sum of Units and Revenue columns in each of our files.
One question here would be , how will this table’s visual look if we add two more files in our folder, one for sales in the USA and one for Sales in the UK (same schema as the existing files of course), and we click Refresh.
Of course, we would see two more rows added to it, one for Units and Revenues in the USA, and the other one for Units and Revenues in the UK.
View more Power BI Tutorials at www.powerbitutorial.org
Another useful Power BI feature to learn is how to create a bookmark in Power BI.
The features available in Power BI are extensive and becoming an expert takes time, effort and some experimentation. We’re always looking for new ways to use the technology we have to improve the day to day lives of ourselves and our customers. Learn more about how Jet Reports gives you an easy way to access and organize the data in Power BI in this 1-minute video.

